
Establishing good market boundaries is crucial to a solid market analysis, but not all market areas (also referred to as trade areas) are created equal. Of course physical barriers–both natural and man-made–affect boundaries and market area delineation, but market areas are also impacted by pockets of demographic outliers, population density, and transportation options. A solid and meaningful market area will take all of these factors into account. As a firm that loves data but, more importantly, loves useful information, here are some tips to keep in mind when establishing a market area for your next project:
Concentric Circles
DO NOT use simple concentric circles. Concentric circles (sometimes referred to as radials) ignore all the important information about any given area such as physical and psychological barriers, real travel time, and the area’s socioeconomic character. This method may be appropriate as a guide or a starting point, but it should never be used as the final market area for a project.
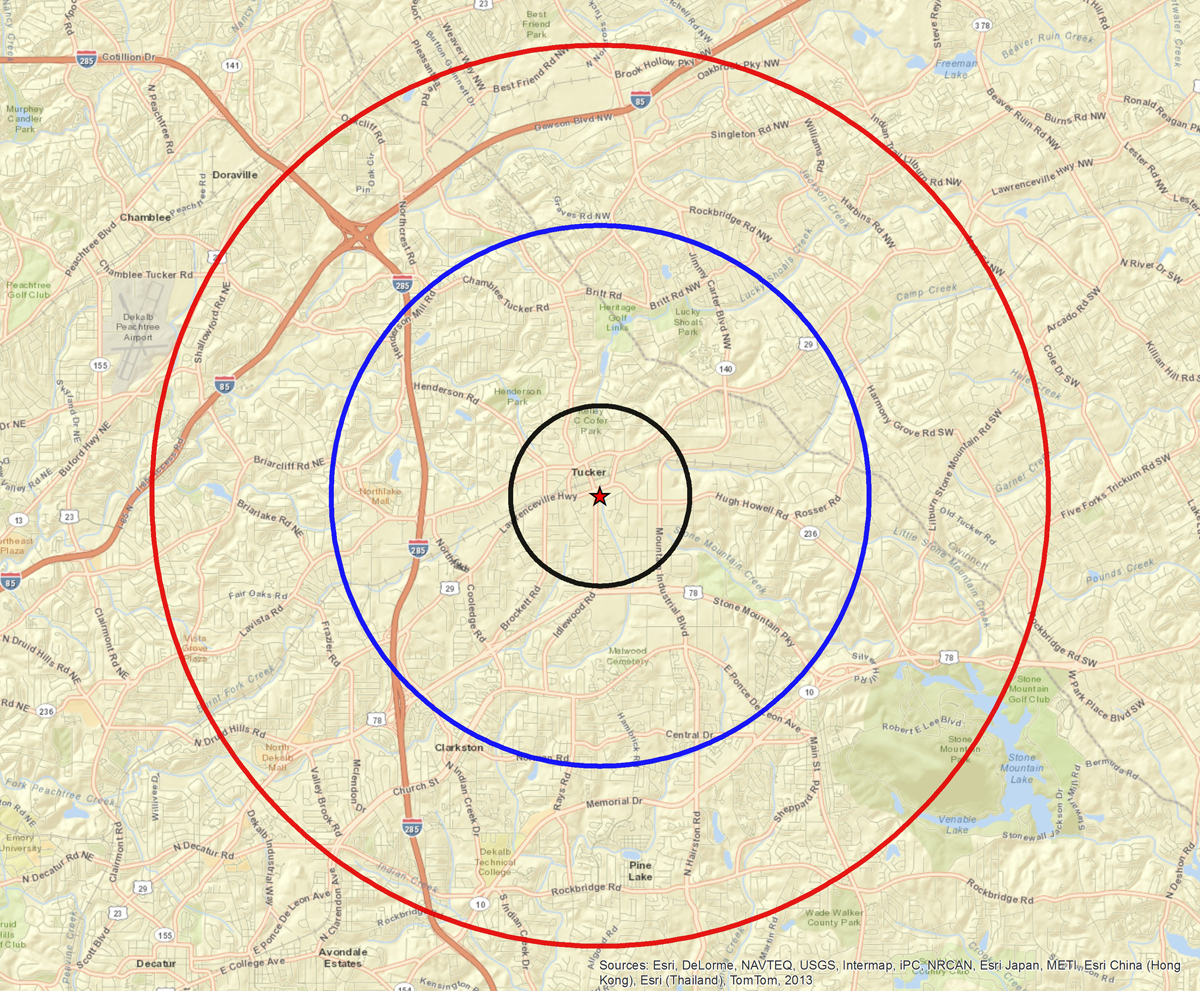
example of concentric circles
Drive Time Polygons
Drive Times are best expressed as polygons rather than concentric circles because polygons calculate the real travel time required to move from one point to another using actual road infrastructure. Drive Time polygons are a great starting point for a project’s market area delineation. It should be noted, however, that Drive Times ignore walking and users of public transportation, which could be problematic depending on the project. Drive times also do not reflect consumer preferences or psychological barriers.
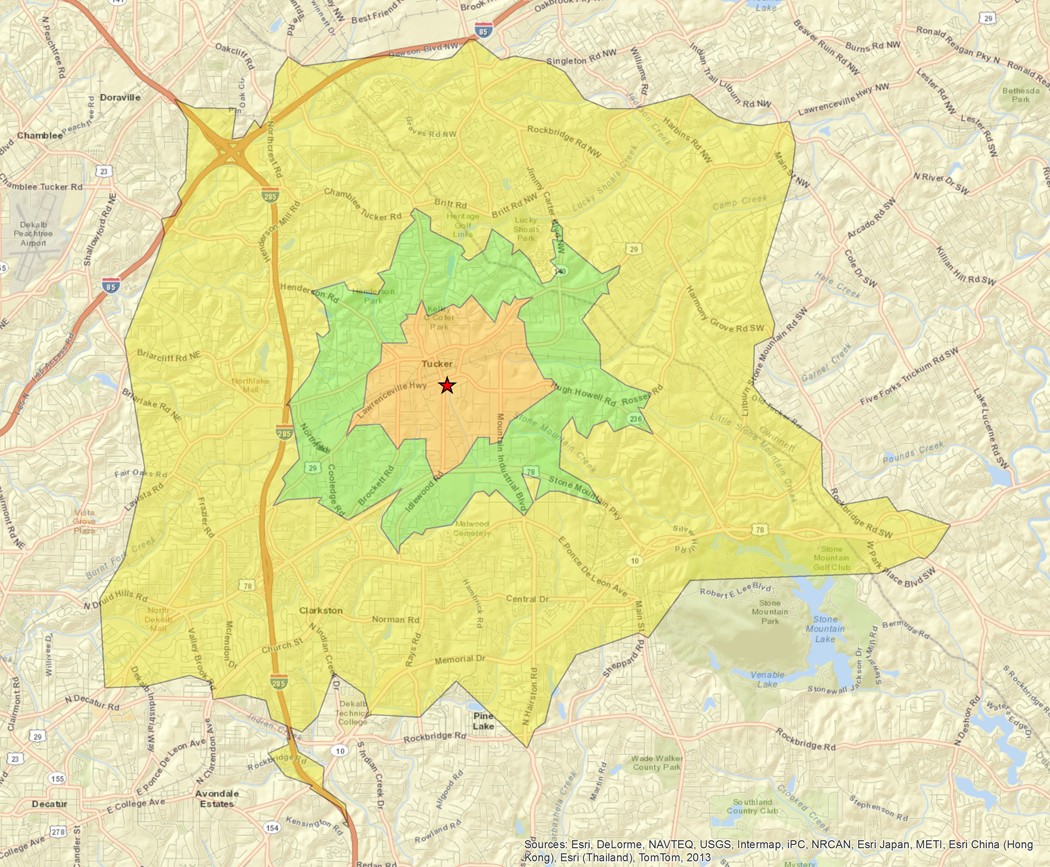
example of drive time polygons
Census Tracts
Census Tracts, although critical to a proper analysis, are also not the best way to delineate a final market area. Census Tracts are a creation of the U.S. Census Bureau, and their sole purpose of is to make it easy for the U.S. Census Bureau to organize information: Tracts consist of several Census Block Groups which are an aggregation of individual Block Points. Block Points are nothing more than actual city and/or country blocks. Therefore, market areas created by simply aggregating entire Census Tracts are equally likely to include irrelevant areas as well as exclude relevant ones because they do not take any of the factors (barries, population density, etc.) that impact a market area into account. This ultimately results in an inaccurate market area that, much like a simple concentric circle, overstates or understates the true socioeconomic conditions that exist within the actual market area.

example of census tracts
Hand Drawn Market Areas
By far, hand drawn market areas are the best way to delineate a project’s market area. Hand trade areas rely on multiple sources of information to establish boundaries. These might include interviews with local stakeholders, thematic demographic maps that visually display socioeconomic character down to the Block Group level, or oversetting thematic data with drive time polygons. This is important because a useful market area isn’t bound by arbitrary political boundaries; it should be based on all of the information available.

example of a hand drawn market area
Once you’ve delineated the final market area, then you must spatially gather the data associated with the people, housing units and businesses in order to build a profile of exactly “what” the trade area contains. It is during this step that planners, developers and analysts sometimes make the mistake of choosing the wrong tools to do the job. The only proper tool for apportioning data to a market area is a Geographic Information System (GIS). Without a properly outfitted GIS, spatial data is going to be miscounted and miscalculated. Here’s why: This map shows a close-up of a market area boundary (red) and a Census Tract (black) that is bisected by the market area. The area to the right of the red boundary is INSIDE the market area. The area to the left of the red boundary is OUTSIDE of the market area.
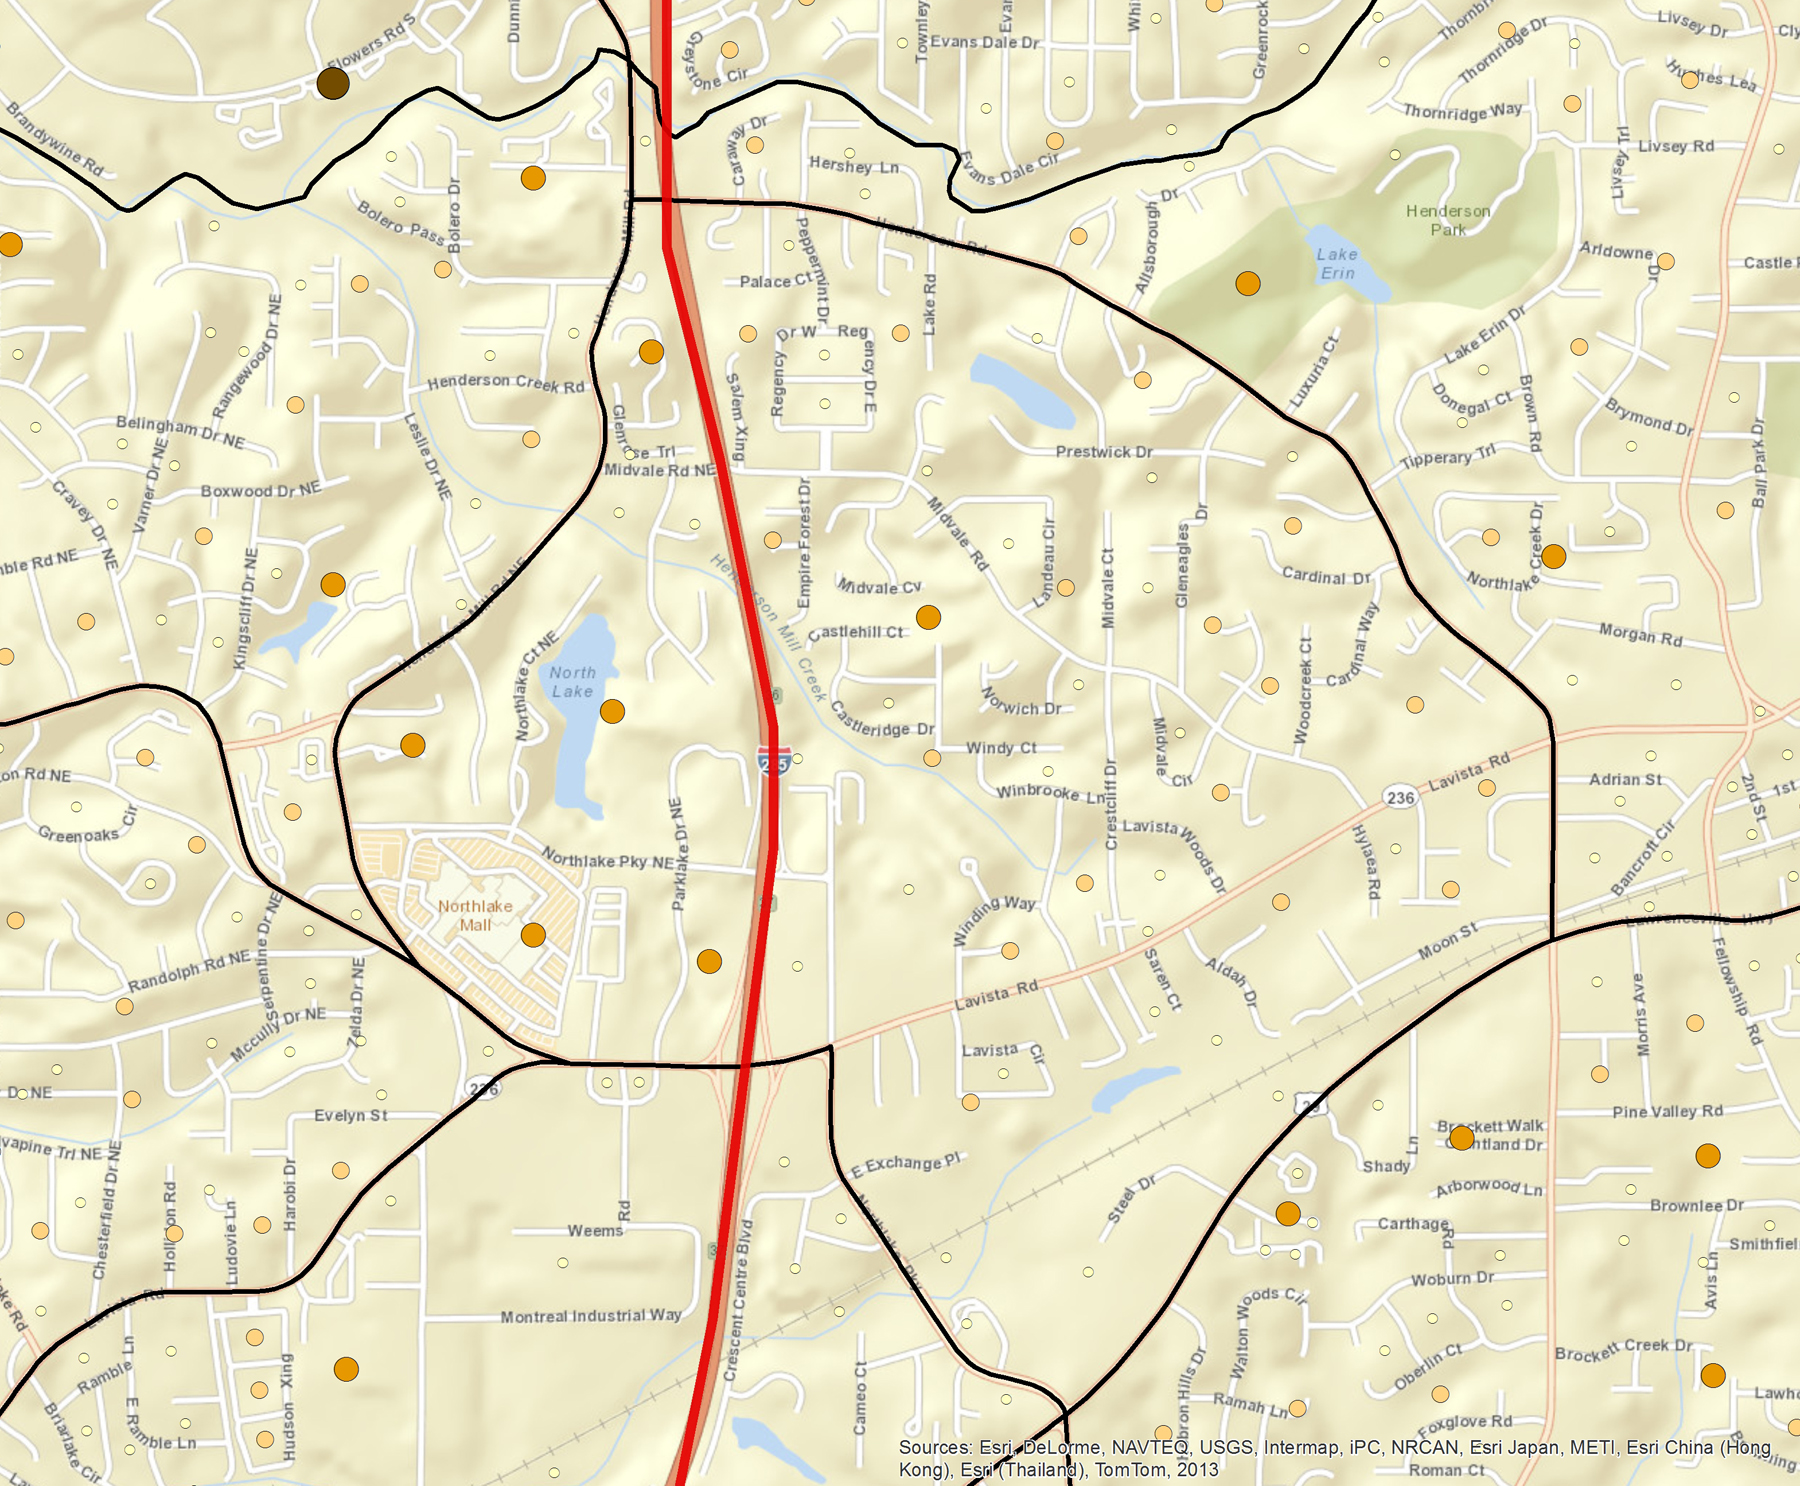
Census Tracts bisected by a market area boundary
Let’s assume you have data from the U.S. Census Bureau for this particular Tract. How would you go about the process of determining the number of households within the market area? A lot of guesswork could be involved. For example, visually it seems that 70% of the Tract is within the market area and 30% is outside. It stands to reason, therefore, that 70% of the households must be within the market area and 30% must be outside. It sounds simple, but let’s look at the actual numbers. Using real Census data, we know the total number of households within this Tract is 2,300 Therefore, we are estimating that there are 1,610 (2,300 x 70%) households within this single Tract that reside within the market area. However, if we use a GIS to do this calculation, we find out the actual number of households within the market area is 1,343. That means we over counted this single Tract by 267 households. The typical market area cuts through 20 or more Census Tracts (depending on the type of project and the density of the population). That means there are at least 20 opportunities for estimation and calculation errors from manually assembling this market area data. The difference between the estimation and the actual number has real consequences: at this level, bad information could either potentially provide support for a project that should not be supported OR dissuade a project that is actually viable. In sum, there is a lot of money at stake when apportioning data to a market area. If you don’t use a GIS to apportion the data for you, then miscalculations will assuredly occur, effectively wasting many people’s time and money.
So why does a GIS do a better job of apportioning data to a market area? A GIS is capable of accurately apportioning population, household, housing unit and business data because it uses the location of Census Block Points to determine exactly how many people, households, housing units, or businesses, are within a market area’s boundaries. Let’s look at the zoomed-in map again.
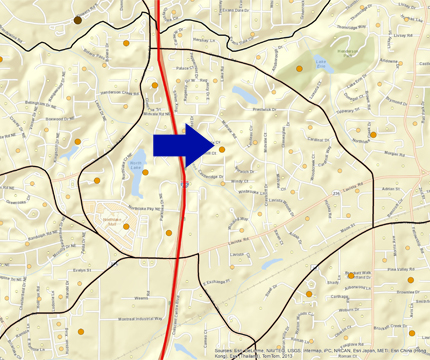
Census Block Points in relation to the market area
The dots you see on the map are proportional symbols that represent the actual physical location of Census Block Points. Block Points contain four types of information for each city/country block that it represents – total population, total households, total housing units, and the total number of businesses. Virtually all Census data (and by extension, third-party demographic data) is associated with one of these “Universes” (that’s U.S. Census lingo). Let’s use the same example market area and Census Tract that we just looked at. A GIS will examine all of the Block Points that reside within the market area and will calculate the actual percent of population, households, housing units and businesses that reside within the market area. Those percentages can then be used to apportion all the data associated with that tract. In other words, we can now accurately determine the precise levels of all data elements within the market area. A GIS can also calculate things like median income for an entire trade area without you ever having to type in a bunch of numbers into a spreadsheet and apply a bunch of assumptions.
A properly outfitted GIS is without a doubt, the most effective tool available for market area delineation and more importantly, for data apportionment to the market area. There is a lot riding on your project(s). Shouldn’t you be using the right tools for the job?
Rick Stein is Principal & Owner of Urban Decision Group (UDG). He is a trained urban planner, GIS expert, and software developer.