
Over the past few weeks there’s been a bit of buzz over Franklin edging out Delaware for the title of Ohio’s fastest growing county. Franklin County has consistently grown for years–a rarity for Ohio as a whole and Midwestern urban areas in general–but its growth rate outstripped Delaware County’s for the first time in over a decade. The percentages are small, Franklin County grew by 1.38 percent to Delaware County’s 1.37, but with a population the size of Franklin County, that small percentage still translates into an estimated additional 16,237 people in one year. That’s roughly five German Villages in a year.
So Franklin and Delaware Counties are bright spots in a state where most counties lose population overall, but what other information can we infer from these growth rates? A friend asked if these growth trends might indicate that individuals in Central Ohio are starting to prefer urban environments over the suburban, with Franklin County representing urbanity and Delaware County the suburbs. It’s a good question, but the short answer is… not really.
Beyond the fact that one year is not enough information to establish any sort of statistically relevant trend, that more people are moving into Franklin County matters a little less than where in Franklin County they are moving (as some have already discussed). After all, there’s a big difference between greenfield development outside of Columbus City limits and moving into the city center. It’s also important to separate natural population changes from migration. Natural population growth includes births and deaths, and the remainder are individuals moving in and out of an area. This type of voluntary population change would obviously be the more interesting demographic for exploring a preference for urban or suburban environments.
But getting back to my friend’s question, there are some basic ways we can look at this data to get a rough idea of where things stand. Again the really interesting question isn’t whether people are moving into Franklin County, it’s where they’re going. We can get an idea of exactly where people are going in the county by disaggregating the Census data from the entire county to census block groups. Since there’s no question on the US Census about a preference for urban or suburban communities, the next step is picking some kind of proxy. I decided to use population density. Population density is usually expressed by the number of people per square mile or square kilometer. Basically, it is the ratio of people to space: a small area with a large number of individuals has a higher population density than a large area with few individuals. Higher population densities, therefore, correlate with more urban environments and lower population densities with suburban or rural areas. My thought was that if people in central Ohio were starting to prefer urban communities, then the population density of Columbus proper should increase over time. Sounds like a perfect excuse to make a few maps.
Before I get to the maps, I have to emphasize that this is a quick survey exercise. I’m an academic at heart and I’d feel horrible if I didn’t point out that I didn’t triple check my numbers, I didn’t account for natural vs. migratory population changes, and I didn’t account for the growth rate (percentage increase) of each census block, or any number or time consuming things that would better validate these results. This is a sketch of population patterns in Franklin County, Ohio, and it’s a game anyone can play. If you have some kind of access to a mapping program, I encourage you to download this free data from American FactFinder and explore on your own. It’s a fun nerdy time.
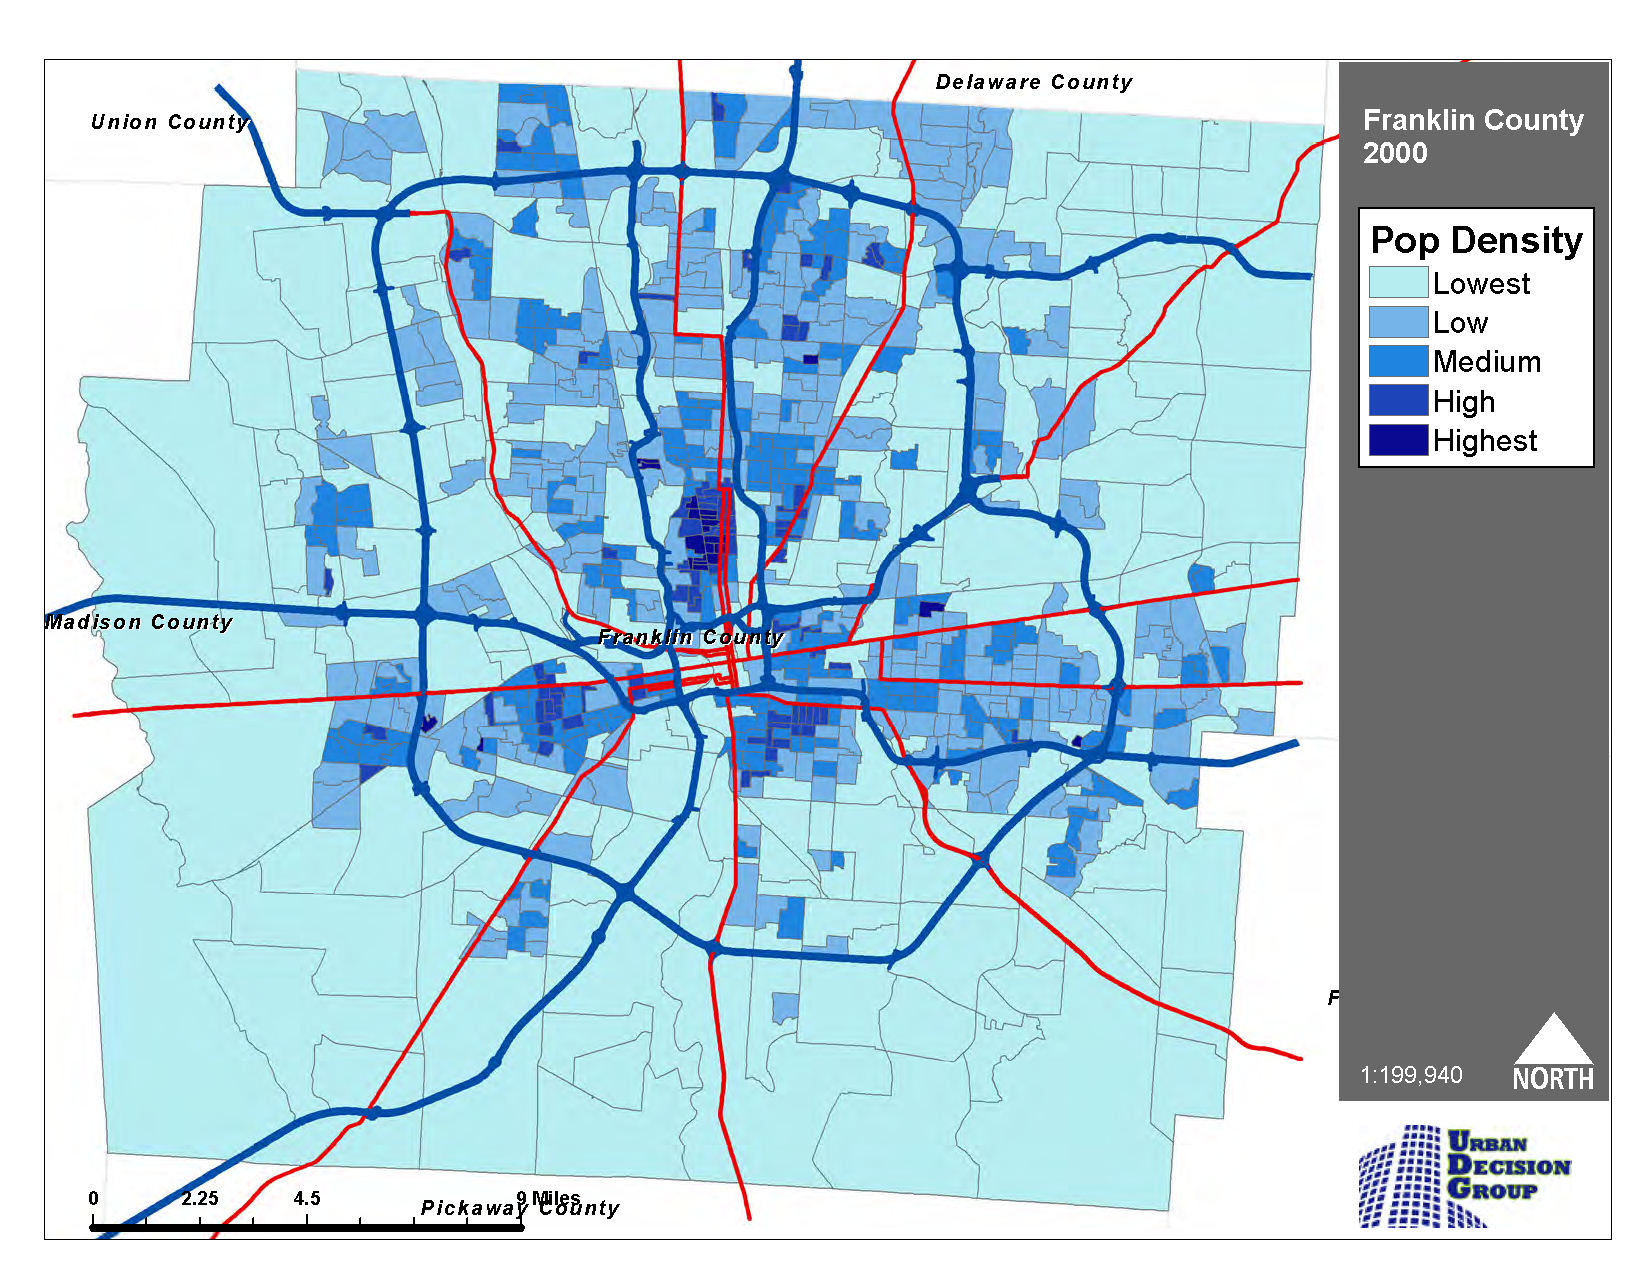 First we have Franklin County’s population density in the year 2000. I calculated population density by dividing the population of each census block group by its area. If I were making this map again I would probably leave the numbers in the population density scale, but at the time I thought the numbers were too confusing because the census block groups can be such small areas. I’d also retain labels for the highways and major roads to make the map easier to understand. Regardless, I think this map largely reflects what you’d expect if you’re familiar with Columbus or Franklin County. The areas with the highest population density are generally within I-270 (the circular outerbelt highway) and are further concentrated immediately south and north of downtown (downtown is smack in the middle of the map within the rectangle of highways).
Next is Franklin County’s population density in 2012 using the census estimates. You can’t see it on the map, but I decided to keep the numeric range behind the density scale (lowest, low, middle, high, highest) the exact same as in the 2000 map because I wanted to see exactly how the population densities did or did not change. My theory was that, given the same scale, an influx of people into the city (a preference for urban living) would result in more dark blue areas around the core.
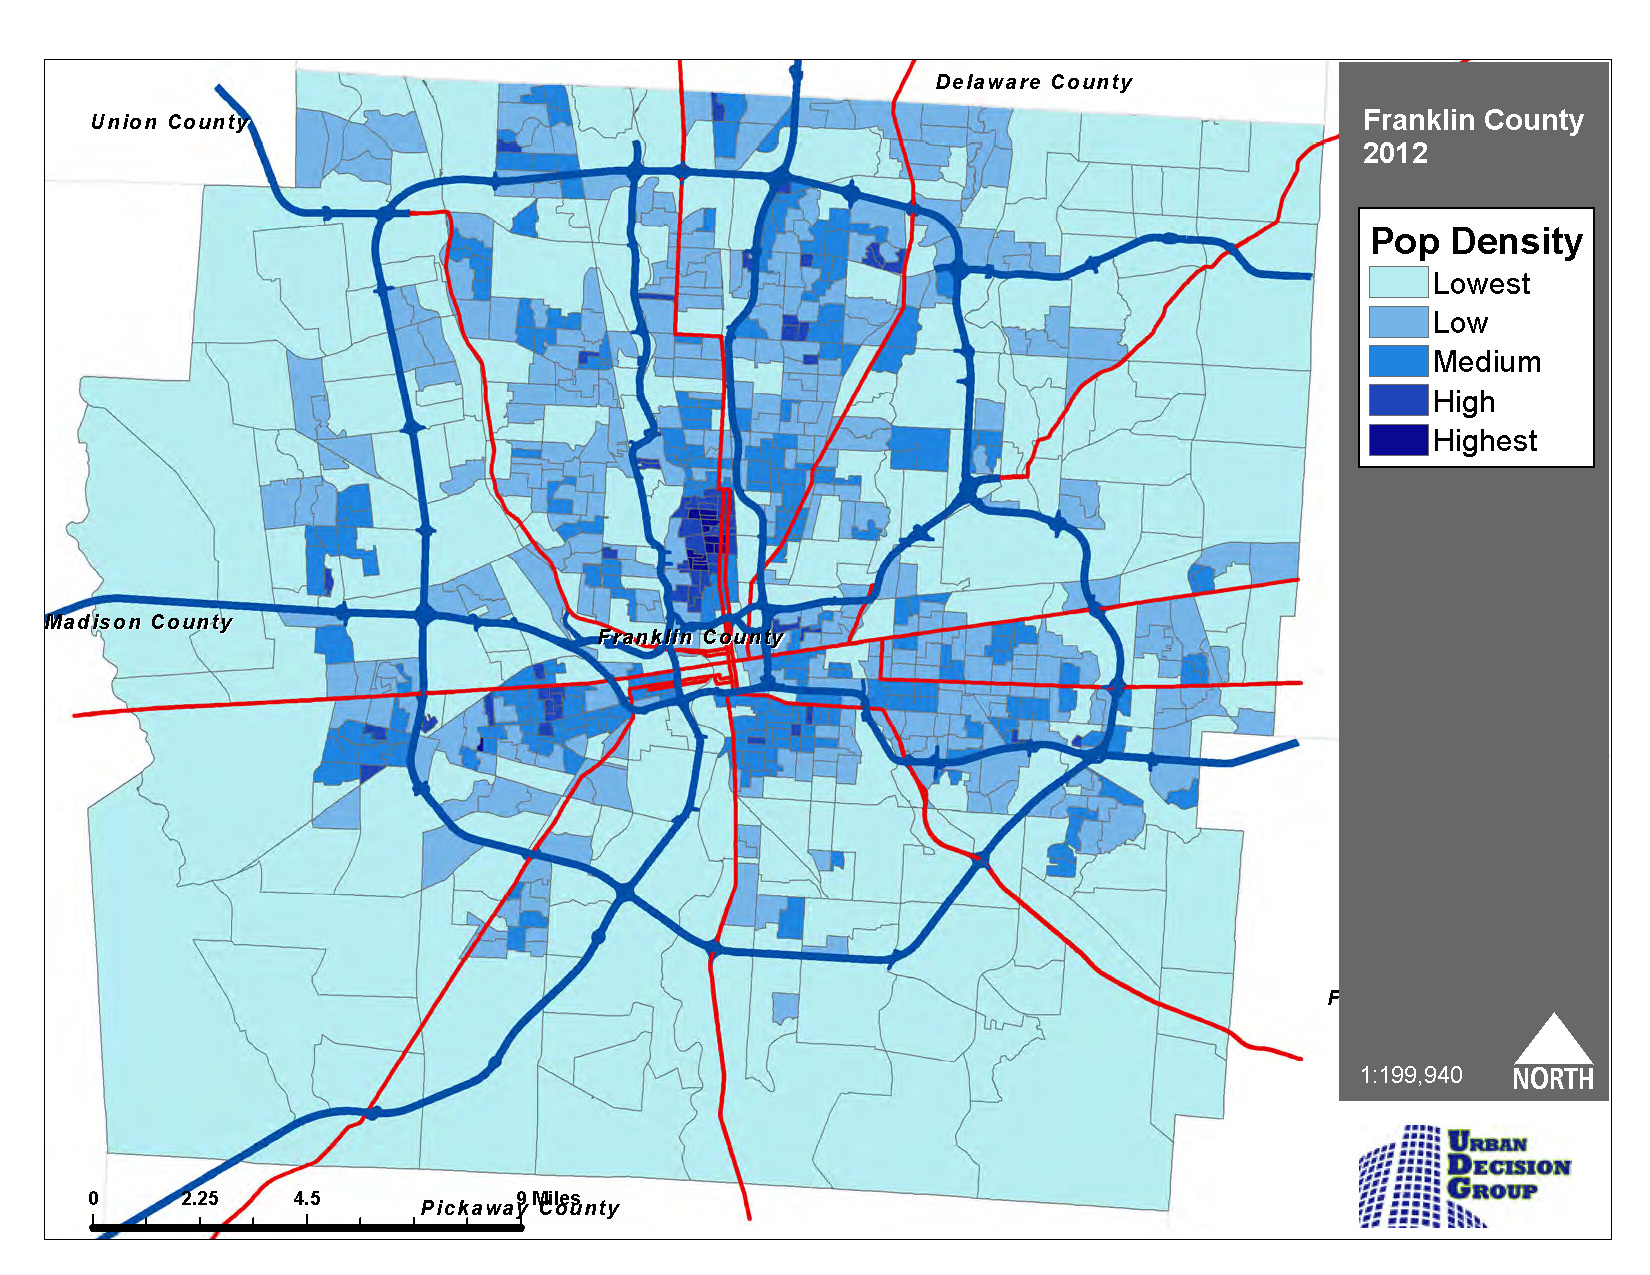
It might be a bit difficult to see at first, but instead of a steady gain in population density in the heart of the city, it seems that the population densities spread out a bit throughout the county, meaning there was actually some density loss in Columbus, particularly in the German Village/South Side area. (It would be interesting to go through foreclosure data to see if this area was particularly affected by the housing crash – perhaps that can be a future map series.) North of downtown in the Short North/University area held pretty steady and density gains are apparent in the communities that surround Columbus proper.
After making these maps to demonstrate why an increase in Franklin County’s population doesn’t necessarily mean an increased desire for urban living, I started to wonder if I was over complicating the issue. Maybe it would be better to simply see how areas lost or gained population over the twelve years. I decided to make another map that just looked at whether each census block group lost population, gained population, or held steady from 2000 – 2012. Again, I did not differentiate between natural and migratory population change.
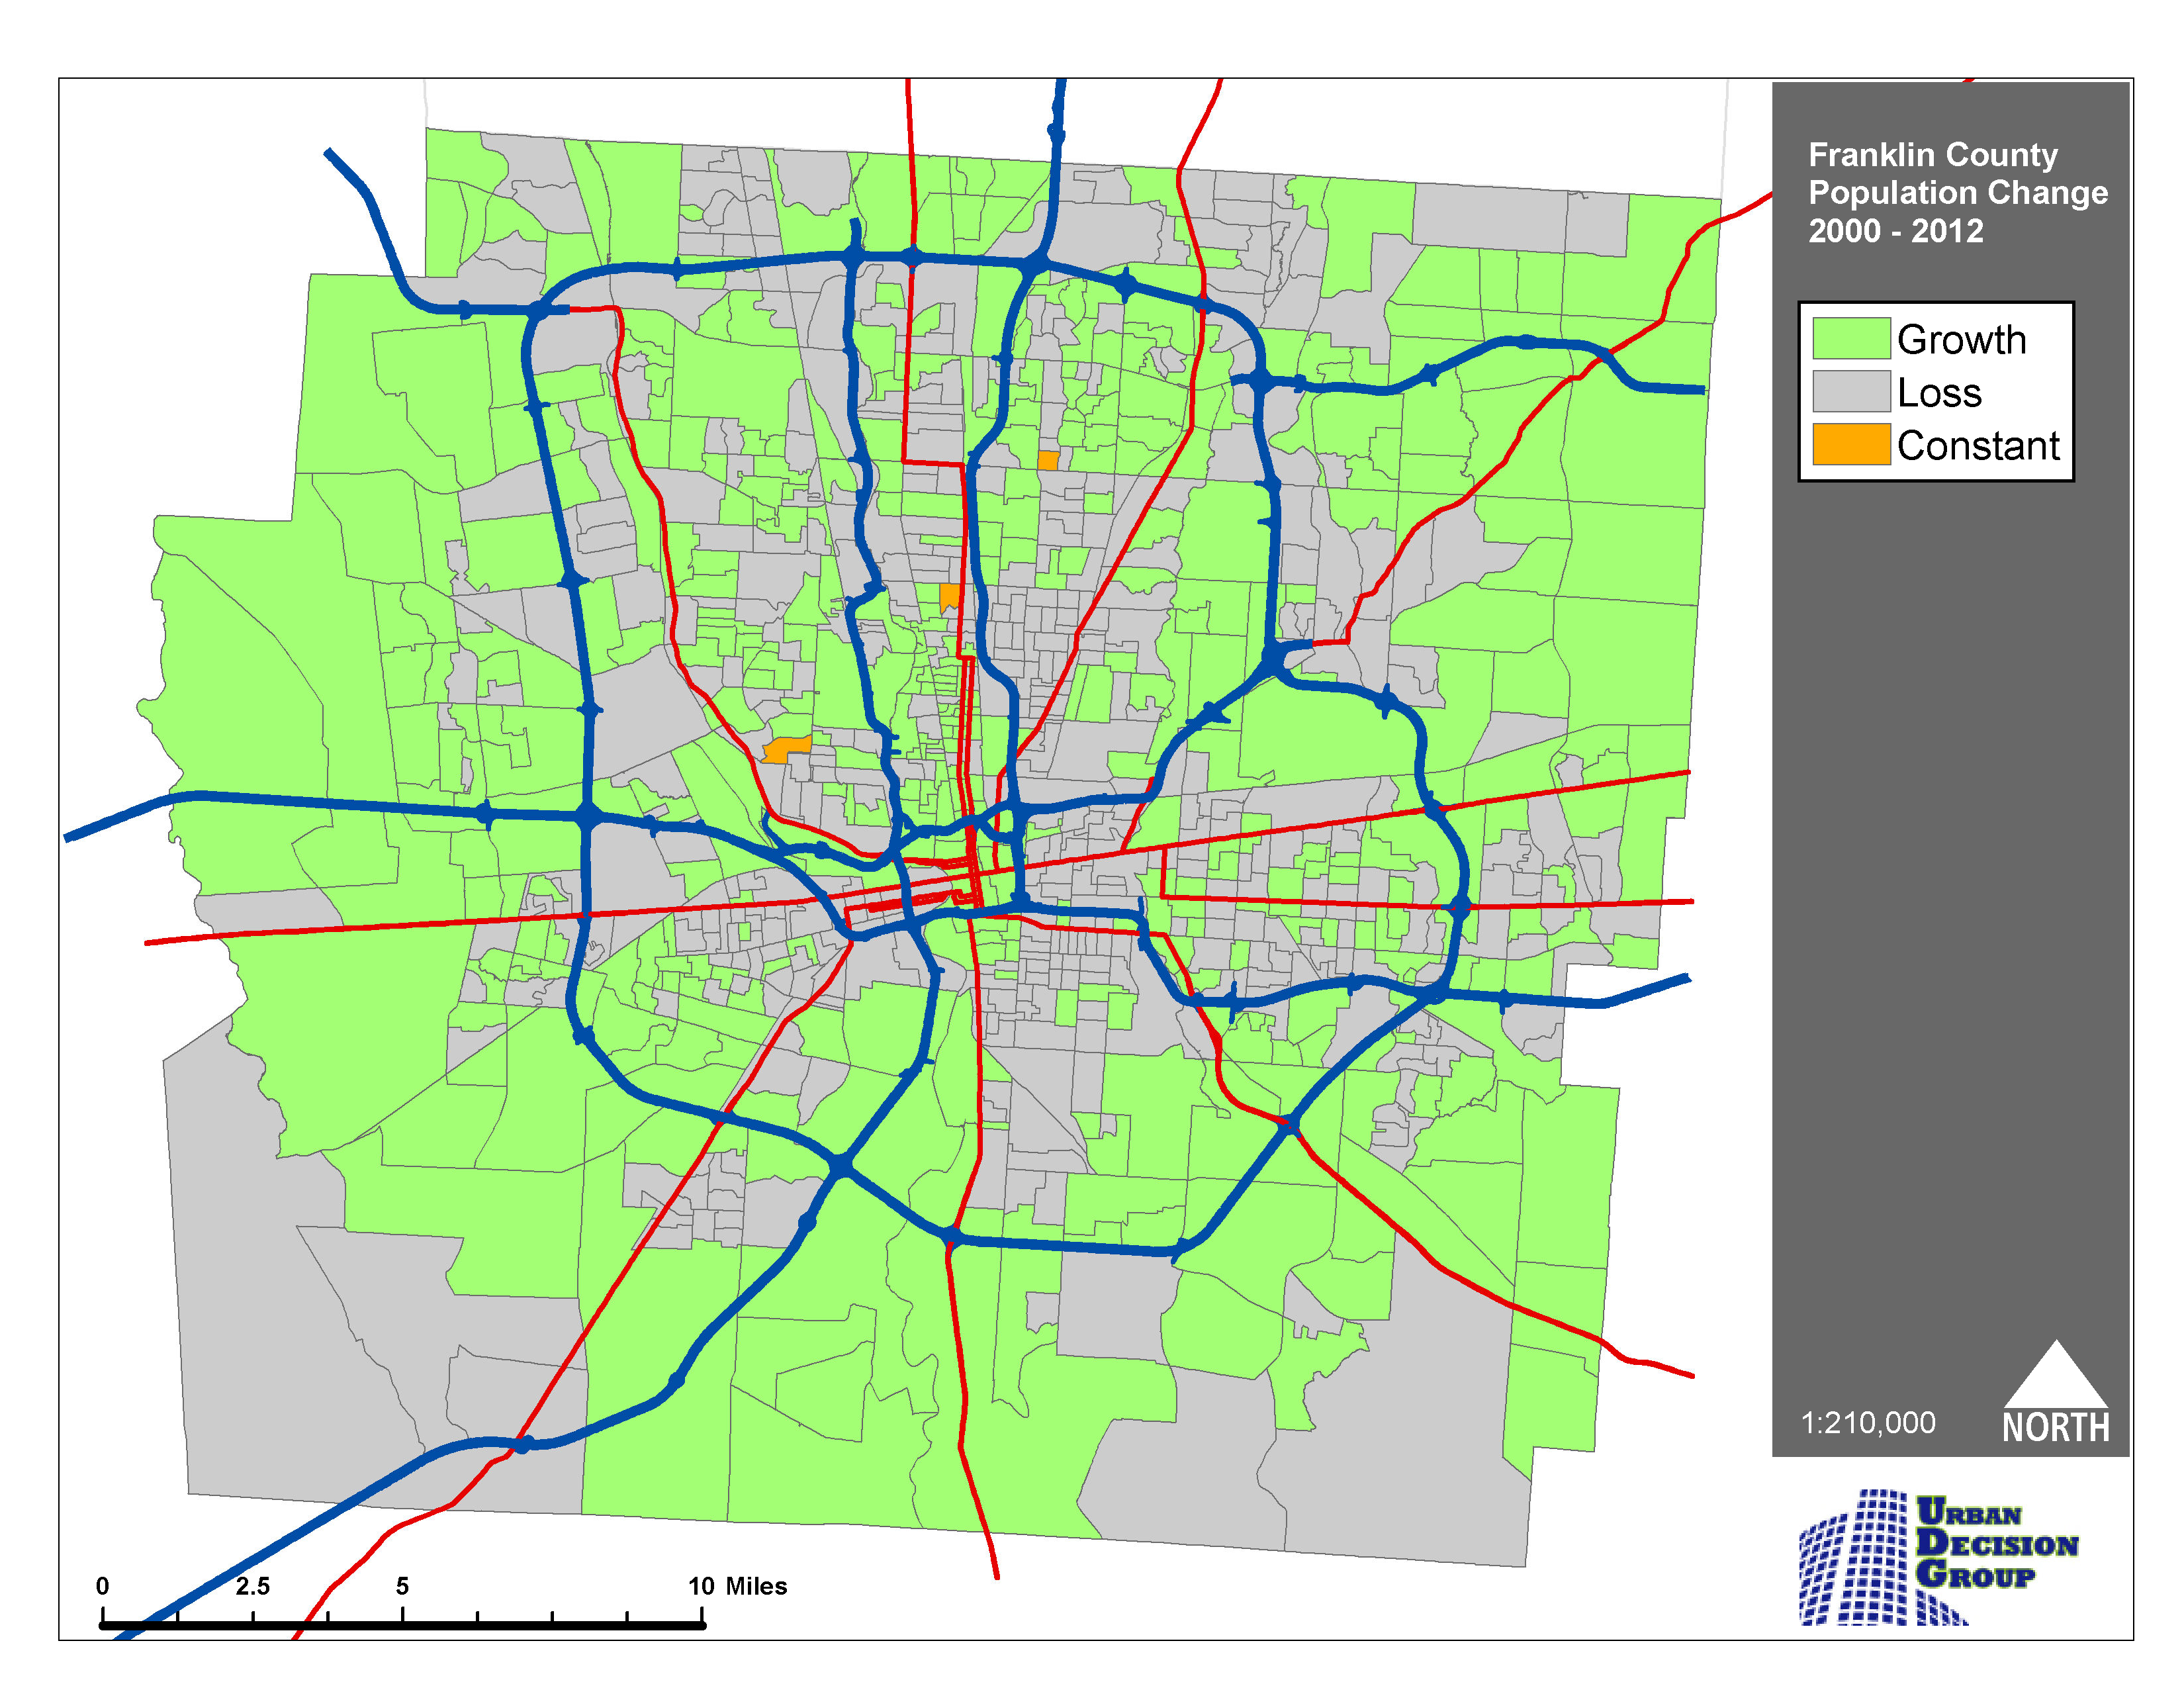
The green areas in this map represent a net population gain since the year 2000 while the grey displays a net population loss. This map largely confirms the 2012 population density map in that the areas that lost density experienced a net loss of population over the same time period. It also suggests in simple binary terms that areas outside of Columbus seem to have experienced population growth in equal or greater terms as the city proper. To double check I made one more map highlighting Columbus’s city limits.
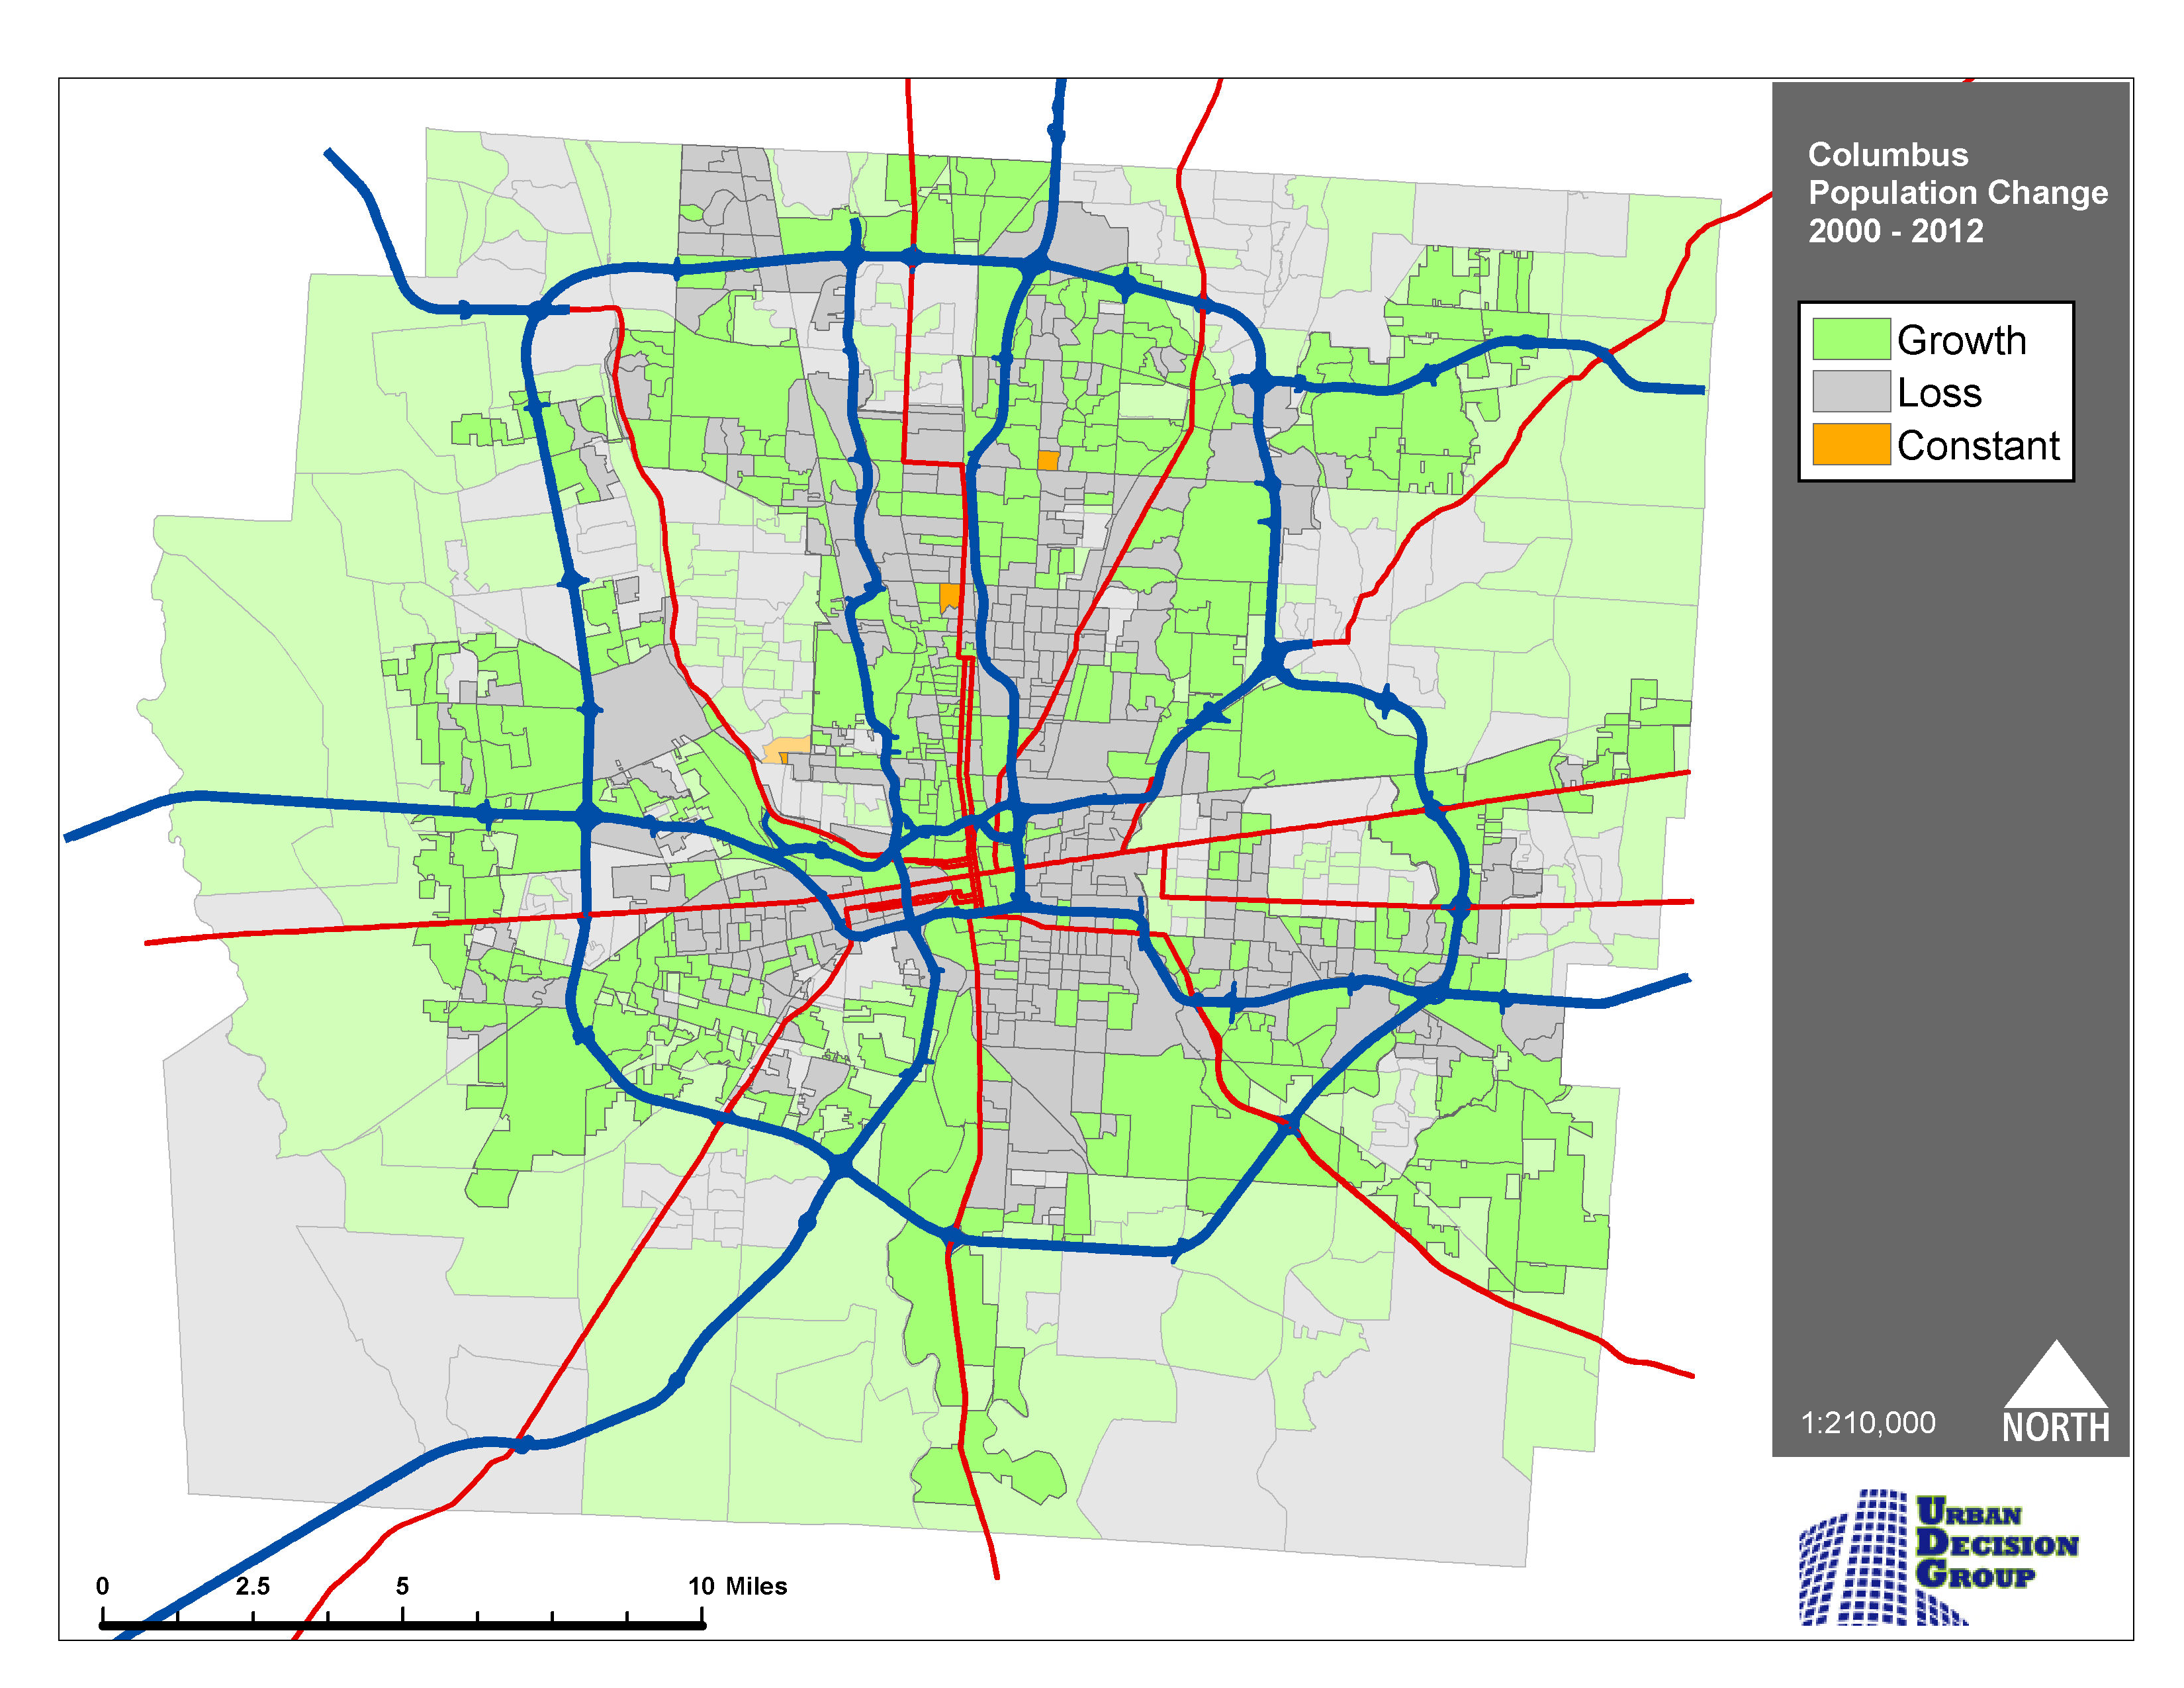
The opaque areas of the map are Columbus proper. This makes it a bit easier to see that although the city itself has experienced a healthy amount of growth over its entire geographic area, there were losses in eastern portion of the city and much of the growth is in the periphery.
At the end of the day, these maps confirmed my suspicions: Sorry, friend. Franklin County’s growth rate doesn’t really mean that more people are choosing an urban life style. However, the last map brought a bit of unexpected optimism. Columbus may not be the densest urban environment, it may have even lost some population density since 2000, but it has experienced positive growth downtown and downtown’s surrounding neighborhoods. I can’t help but feel that this is a good sign; if you’ve seen the development boom in central Columbus lately, you might agree. From the mixed-use development underway at High and Hubbard in the Short North, to the construction of apartments around Columbus Commons, to the the grand opening of the downtown Hills Market, it certainly feels like there’s a renewed momentum for the central area of the city. Perhaps in another ten or so years we’ll look at the census data and see, thanks to present day efforts, that individuals are in fact expressing a preference for urban living in Central Ohio.